From Spreadsheets to Strategy: Why Small Businesses Need Better Reporting
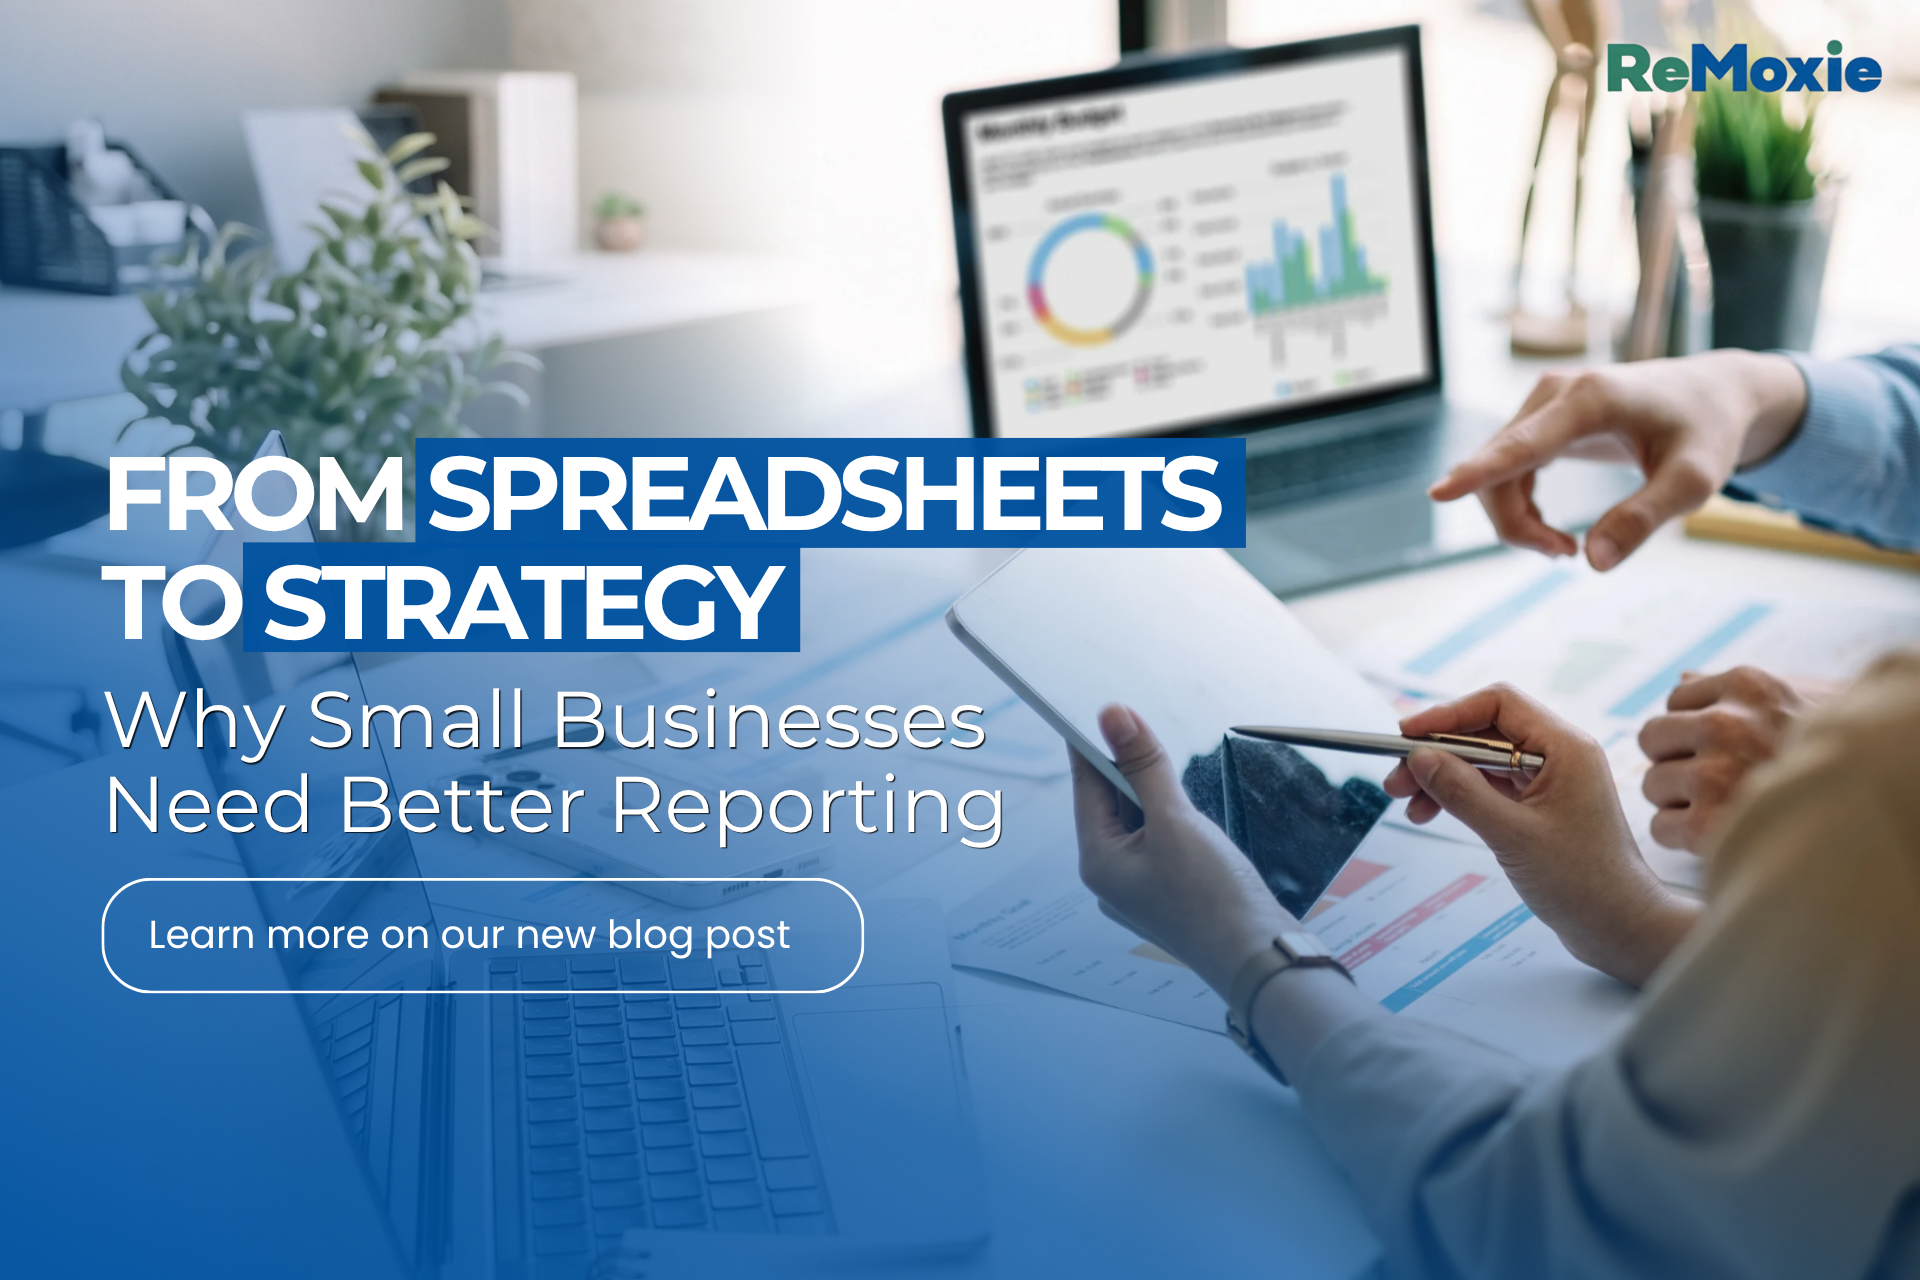
From Spreadsheets to Strategy: Why Small Businesses Need Better Reporting
What if the numbers you already have could tell you exactly where your business is making money, where it is losing money, what is slowing growth, and where your next opportunity is hiding? If you are a small-business owner, startup founder, strategist, or investor, you probably already have more business data than you think. The problem is not always a lack of information. Sometimes, the real problem is that the information is sitting in spreadsheets, scattered across tabs, buried in reports, or waiting for someone to manually turn it into something meaningful.
For many small businesses, spreadsheets are still the backbone of reporting. They track sales, expenses, payroll, leads, customers, project hours, inventory, marketing performance, cash flow, and budgets. There is absolutely nothing wrong with that. In fact, a well-designed spreadsheet can be an incredibly useful business tool. The challenge begins when the spreadsheet becomes so complicated that the business owner spends more time maintaining the numbers than understanding what those numbers are saying.
And in 2026, that distinction matters more than ever.
The U.S. is home to more than 36.2 million small businesses, according to the U.S. Small Business Administration's Office of Advocacy. Small businesses represent almost 46% of private-sector employment, and between March 2023 and March 2024, they created approximately nine out of every ten net new jobs. (SBA Advocacy) These businesses may be smaller than large corporations, but they are making decisions that affect employees, customers, investors, suppliers, and entire communities.
That means better reporting is not simply an administrative improvement. It is a strategic advantage.
Your Spreadsheet Is Not the Problem
Let's be fair to spreadsheets. They are affordable, flexible, familiar, and accessible. For a growing business, a spreadsheet can be the perfect place to start. A founder can create a sales tracker in an afternoon, a marketing manager can monitor campaign results, and an operations team can build a simple budget without purchasing an expensive business intelligence platform.
The problem is not the spreadsheet itself. The problem is using a spreadsheet as a database, reporting system, forecasting model, financial dashboard, project-management tool, and decision-making system all at the same time.
As a business grows, the volume and complexity of information grow with it. More customers mean more transactions. More employees mean more payroll and productivity data. More marketing channels mean more performance metrics. More products or services mean more revenue streams and cost categories. Eventually, the question changes from "Where is the number?" to "What does this number mean?"
That is where better reporting becomes valuable.
Research into operational spreadsheets has demonstrated why accuracy matters. In one study of 25 operational spreadsheets from five organizations, researchers identified 381 potential errors, 117 of which were confirmed by the spreadsheet developers. Of the confirmed errors that affected outputs, seven produced impacts exceeding $10 million, while the largest identified error was $100 million. (ScienceDirect)
That does not mean every small-business spreadsheet is a financial disaster waiting to happen. It does mean that important business decisions should not depend on complicated spreadsheets that no one has reviewed, understood, or designed for long-term use.
Reporting Should Answer Questions, Not Just Display Numbers
A report is useful when it helps you answer a business question.
How much did we sell this month? That is a reporting question.
Why did sales decline? That is an analytical question.
Which service generated the strongest margin? That is a strategic question.
Which customers are becoming less profitable? That is a business-risk question.
Where should we invest next quarter? That is a decision-making question.
The evolution from spreadsheet to strategy happens when reporting moves beyond showing numbers and begins explaining what those numbers mean.
This is the real value of business dashboards and data visualization. A dashboard can take hundreds or thousands of rows of information and turn them into a visual story through charts, graphs, KPIs, comparisons, trends, and alerts. Instead of opening multiple spreadsheet tabs and trying to connect the dots yourself, you can see the important information in one place.
Recent academic research supports this idea. A 2024 experimental study involving 524 participants found that the format, currency, and completeness of information in dashboard visualizations affected decision-making quality by reducing perceived task complexity and increasing information satisfaction. (ScienceDirect)
In other words, how information is presented matters.
A number buried in a spreadsheet may be technically correct but practically invisible. A well-designed graph can make the same number immediately understandable. Don't you agree?
Better Dashboards Create a Clearer Business Picture
Imagine opening your weekly business dashboard and immediately seeing five things: revenue, profit margin, cash flow, sales pipeline, and customer acquisition cost.
You notice that revenue is up 12%, but your profit margin has dropped by 4%. A sales graph shows that one service is generating significantly more revenue than the others, but a cost chart reveals that it also requires considerably more resources. Your pipeline report shows that you have plenty of leads, but your conversion rate has declined.
That is a very different experience from scrolling through a spreadsheet.
The dashboard has not magically created new data. The information was already there.
The difference is that the data has been organized into a format that helps you see relationships, patterns, changes, and priorities without spending hours pulling information together manually. That is where dashboards can create real business value.
A well-designed dashboard can save time, money, and resources by reducing repetitive reporting tasks, minimizing manual data gathering, and giving teams faster access to the information they need. Instead of having employees spend hours searching through spreadsheets, updating reports, or compiling information from multiple systems, a centralized dashboard can bring key metrics together in one place.
The time saved can then be redirected toward higher-value work—serving customers, improving operations, generating sales, or making strategic decisions. At the same time, better visibility can help businesses identify unnecessary spending, resource bottlenecks, underperforming areas, and opportunities to improve efficiency before they become larger problems.
Research involving managers and dashboard use has also found that strategy alignment and interactive management controls are associated with dashboard use, perceived managerial performance, and perceived organizational performance. (ScienceDirect)
This is the reason why a good business dashboard should never be created simply because dashboards look impressive. The goal is not to fill a screen with colorful charts. The goal is to turn existing data into usable business intelligence while reducing the time, cost, and resources required to get there.
Ultimately, the best dashboard is not the one with the most graphs. It is the one that helps your team understand what is happening, identify what needs attention, and act faster with the resources you already have.
Small Businesses Cannot Afford to Make Decisions in the Dark
This becomes even more important when we look at the financial pressure many small businesses are facing.
The Federal Reserve's 2025 report on employer firms found that 75% of small businesses cited rising costs of goods, services, and wages as a financial challenge. Another 56% reported difficulty paying operating expenses, while 51% cited uneven cash flow. At the same time, reaching customers and growing sales was the most commonly reported operational challenge, cited by 57% of firms. (Fed Small Business)
Those numbers tell us something important: small-business owners are making decisions in an environment where margins, cash flow, customer acquisition, and operating costs matter enormously.
When conditions are tight, "I think we're doing okay" is not enough.
Business owners need information, fast, to orchestrate their next business strategy. They need to know which products are profitable. They need to know which customers generate sustainable revenue. They need to know whether marketing spending is producing results. They need to know where expenses are increasing. They need to know how much cash is available and how long it will last. They need to know whether sales growth is actually translating into profit.
Better reporting gives them a way to see those answers consistently.
Data-Driven Decision-Making Is No Longer Just for Big Companies
There was a time when business intelligence sounded like something reserved for large corporations with data scientists, analysts, and expensive enterprise software. That is changing.
Today, even a small business can connect spreadsheet data, accounting information, CRM activity, marketing metrics, project data, and operational information into a more accessible reporting system.
IBM describes data-driven decision-making as using data and analysis rather than intuition alone to inform business decisions. Its recommended process includes defining objectives, preparing and organizing data, analyzing it, drawing conclusions, implementing actions, and measuring outcomes against KPIs. (IBM)
Reporting should not end with "Here are the numbers." It should lead to "Here is what happened, here is why it matters, here is what we should watch, and here is what we can do next."
That is the difference between reporting and strategic reporting.
The 2026 Business Environment Makes Better Reporting Even More Important
Small businesses are also entering an increasingly technology-driven environment.
The U.S. Chamber of Commerce reported in 2025 that 58% of small businesses said they were using generative AI, up from 40% in 2024 and 23% in 2023. The report also found that 84% of small businesses planned to increase their use of technology platforms. (U.S. Chamber of Commerce)
AI can help businesses summarize information, automate repetitive work, identify patterns, generate forecasts, and support analysis. But there is an important lesson here: more technology does not automatically create better decisions.
AI is only as useful as the data and business context behind it.
If your data is inconsistent, incomplete, duplicated, poorly categorized, or trapped across disconnected spreadsheets, adding AI on top of it does not solve the underlying reporting problem. It can actually make the problem harder to see.
The 2025 IBM Chief Data Officer Study, which surveyed 1,700 chief data officers globally, found that 83% said data silos hinder innovation and impede real-time analytics and decision-making. Only 26% said they were confident that their data capabilities were ready to support new AI-enabled revenue streams. (IBM)
The lesson for small businesses is surprisingly simple: before asking what AI can do with your business data, make sure your business can actually trust and understand that data.
You Do Not Have to Throw Away Your Spreadsheets
This is where we want small-business owners to feel a little less overwhelmed.
Better reporting does not necessarily mean replacing every spreadsheet you have. It can mean improving what you already have.
A spreadsheet can become the source of a well-designed dashboard. Existing sales data can become a monthly performance report. Financial information can become a cash-flow visualization. A customer list can become a retention and revenue analysis. Project data can become a profitability report.
The transformation can be gradual. Start with the information that matters most. Then, identify your core KPIs. Clean up inconsistent data. Remove unnecessary columns and duplicate information. Standardize categories. Create formulas that can be checked. Separate raw data from calculations. Build charts that answer actual business questions. Then create a dashboard that gives decision-makers a clear view of performance.
The objective is not to make your reporting more complicated. It is to make your business easier to understand.
The Right KPIs Can Change the Conversation
One of the biggest reporting hurdles small businesses encounter is tracking everything. More metrics do not necessarily mean more insight.
A business might track website visits, social media followers, email opens, leads, calls, proposals, sales, revenue, expenses, hours, invoices, receivables, customer reviews, and dozens of other metrics. But if the owner cannot explain which numbers actually influence profitability and growth, the reporting system is creating noise instead of clarity.
A better approach is to connect KPIs to business objectives.
If your priority is profitability, track gross margin, operating expenses, net profit, and profitability by product or service.
If your priority is sales growth, track qualified leads, conversion rate, average deal value, sales cycle, and revenue growth.
If your priority is cash flow, monitor accounts receivable, accounts payable, cash on hand, operating cash flow, and upcoming obligations.
If your priority is customer retention, monitor repeat purchase rate, churn, customer lifetime value, and customer acquisition cost.
The right dashboard does not simply tell you what happened. It helps you determine what deserves your attention next.
Reporting Can Also Strengthen Investor and Financing Conversations
For startups and growing businesses, reporting has another important function: credibility.
Investors, lenders, strategic partners, and potential buyers want to understand how a business performs. They want evidence of growth, profitability, customer demand, operational efficiency, and financial discipline.
A polished dashboard will not replace sound financial statements or due diligence, but consistent reporting can make business performance easier to communicate and understand.
This matters because small businesses remain a major part of the U.S. economy. The SBA reports that small businesses represent 99% of U.S. businesses and contribute nearly half of national GDP. (Small Business Administration)
When a business can clearly explain its numbers, it is better positioned to have conversations about growth, financing, hiring, expansion, partnerships, and investment.
Good reporting is therefore not just an internal management tool. It can become part of the business's story.
Women-Owned Businesses Deserve Reporting Systems That Support Growth
Now, let's delve into relevant, women-owned businesses and lean, founder-led companies. According to the U.S. Census Bureau's latest business-owner data, women owned 14.2 million U.S. businesses, representing $2.8 trillion in receipts. Among employer firms, approximately 1.4 million were women-owned. (Census.gov)
The Census Bureau has also reported that women owned 42.7% of U.S. non-employer businesses in its 2022 data, representing 12.7 million businesses and $411.6 billion in receipts. (Census.gov)
Many founder-led and women-owned businesses operate with lean teams. The owner may be the CEO, salesperson, marketer, client manager, recruiter, and financial decision-maker all at once. That makes time utterly valuable.
A reporting system that requires hours of manual spreadsheet work every week is taking valuable time away from strategy, customers, sales, leadership, and growth. A better system should give that time back.
It should make it easier for the business owner to open a report and understand what needs attention without spending the first hour figuring out where the numbers came from.
The ROI of Better Reporting Is Bigger Than a Dashboard
It is tempting to ask, "How much money will a dashboard make me?"
That is a fair question, but the return on better reporting is not always a single revenue number.
The ROI can come from reducing reporting time, identifying unnecessary costs, catching problems earlier, improving pricing decisions, prioritizing profitable services, reducing missed opportunities, improving cash-flow visibility, and helping leaders make faster decisions.
Research on data visualization investments identifies time savings, productivity improvements, improved decision-making speed, and revenue generation linked to better decisions as important ways to evaluate the return from visualization initiatives. (SSRN)
Let's say, if a business owner or operations manager spends five hours every week manually compiling reports, that is approximately 260 hours a year. If better data organization and dashboard automation reduced that reporting workload by just 50%, the business would recover approximately 130 hours annually.
Those hours can be redirected toward selling, serving customers, developing new offerings, improving operations, or leading the team. The exact financial return will vary from business to business. But the principle is straightforward: time spent producing information is not the same as time spent using information.
The goal is to move more of the owner's time into the second category.
From Spreadsheets to Strategy
The future of small-business reporting is not necessarily about having the most sophisticated technology. It is about having the right information at the right time in a format people can understand.
That might begin with Excel or Google Sheets. It might eventually include Power BI, Looker Studio, Tableau, accounting integrations, CRM reporting, automated workflows, or AI-assisted analytics. The technology can evolve as the business grows.
What should remain constant is the purpose.
- Your reporting should help you understand performance.
- Your dashboards should help you see patterns.
- Your graphs should help you communicate trends.
- Your KPIs should help you focus.
- Your data should help you make decisions.
And your decisions should ultimately support the goals of the business.
We do not believe small businesses need to choose between spreadsheets and strategy. The spreadsheet can be the starting point. With thoughtful structure, clean data, useful dashboards, meaningful graphs, and clear reporting, the information you already have can become one of your most valuable strategic resources.
In 2026, business owners do not need more numbers simply for the sake of having more numbers. They need better visibility, better questions, and better decisions. If your current spreadsheets are making you work harder just to understand your own business, it may be time to stop treating reporting as an administrative task and start treating it as a strategic asset. At ReMoxie, we believe your data should work for you, not the other way around. Let’s turn your spreadsheets, reports, and business data into clear dashboards and actionable insights that give you less data to decipher and more direction for growth.
References
- https://advocacy.sba.gov/2025/06/30/new-advocacy-report-shows-the-number-of-small-businesses-in-the-u-s-exceeds-36-million
- https://advocacy.sba.gov/wp-content/uploads/2026/02/FINAL_FAQsAboutSmallBusiness_2026_012826.pdf
- https://www.fedsmallbusiness.org/reports/survey/2025/2025-report-on-employer-firms
- https://www.fedsmallbusiness.org/research-types/chartbooks/2025-main-street-metrics
- https://www.census.gov/newsroom/press-releases/2025/business-owner-characteristics.html
- https://www.census.gov/newsroom/press-releases/2025/nonemployer-business-characteristics.html
- https://www.uschamber.com/technology/empowering-small-business-the-impact-of-technology-on-u-s-small-business
- https://www.ibm.com/think/topics/data-driven-decision-making
- https://www.ibm.com/think/news/what-1700-chief-data-officers-are-saying-about-data-ai
- https://www.mckinsey.com/capabilities/quantumblack/our-insights/catch-them-if-you-can-how-leaders-in-data-and-analytics-have-pulled-ahead
- https://www.sciencedirect.com/science/article/pii/S0378720624000934
- https://www.sciencedirect.com/science/article/abs/pii/S0167923609000335
- https://link.springer.com/article/10.1007/s11704-023-2384-6
- https://papers.ssrn.com/sol3/papers.cfm?abstract_id=5596030
ReMoxie Blog